X 0 1 2 3 4 5 6 7 8

Section Three
F and G Forces
11. Relativity vs CM
X 0 1 2 3 4 5 6 7 8 |
|
Section Three |
| F and G Forces |
| ___ |
| 11. Relativity vs CM |
| 12. Kepler's 2nd |
| 13. Complex Plane |
| 14. Szebehely Eqn. |
| 15. Transitioning |
| 16. Shock Wave |
| 17. Quaternions |
| 18. Envelope Curve |
TAB 16 SHOCK WAVE DYNAMICS
When two wave fronts meet, as in a problem like the Earth Mars trajectory modeled by two boundary value problems, a third wave front is formed called a shock wave.
In multi dimensional space this shock wave must have a beginning and an end - predicated by an exponential envelope and with limits at the inner and outer wheels, like drilling holes at the ends of a stress crack to keep it from continuing to propagate through the whole surface or plane.

Nested Hysteresis Loops
The next illustration shows how, versus the system wave diagram, the planets form a continuum of a sinusoidal wave vis-à-vis an envelope curve.

Symmetric vs. Invariant Plane and Planetary Motion
The planets form a continuum of a sinusoidal curve, versus the envelope curve, which is consistent with the system wave hypothesis. This kind of a phenomena is exhibited on the atomic level (recall that the equation for gravity is the same as the equation for electrostatics, except for the constant of proportionality).
Electrostatic potential in the vicinity of a nucleus is modeled by the potential function
![]()
called the screened Coloumb potential because it falls off with distance more rapidly than 1/r thus taking into account the partial cancellation or screening of the nuclear charge by the atomic electrons. It is worth noting here that, under certain conditions, there can exist bound orbits for which the total energy is postitive.
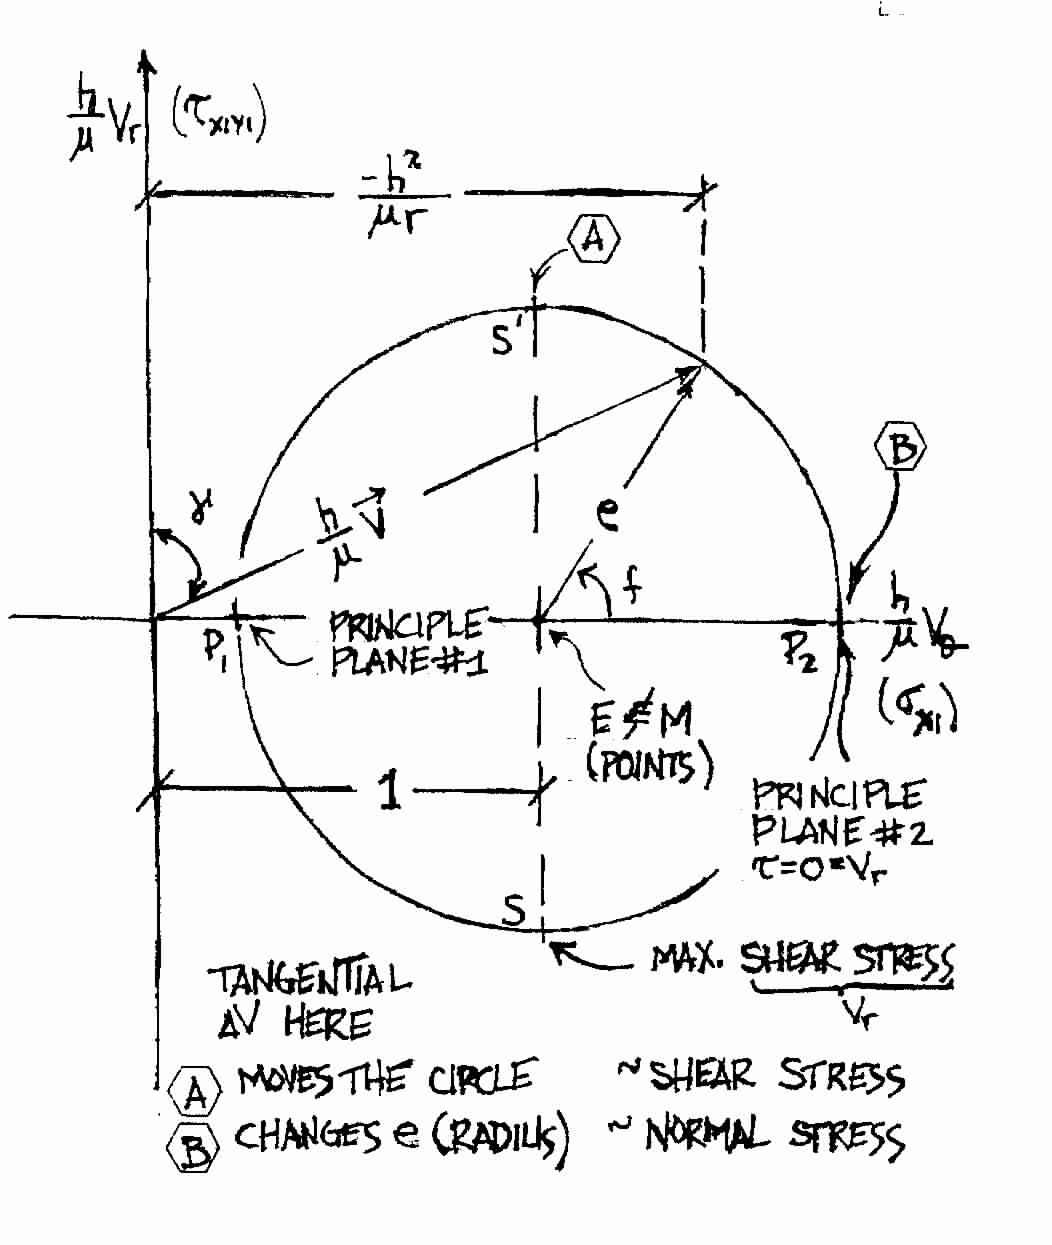
The next illustration is a study of the Earth to Mars trajectory that lends itself to the Mohr stress/strain analogy of the following figure.

Relationships between the various Conjunctions and the Time Lines
The following figure draws on the similarities between the velocity Hodograph or phase diagram for an interplanetary trajectory and the stress-strain diagram called Mohr's Circle used in the analysis of solid objects under load. The latter has two principal planes as noted, and stress is correlated to velocity in the radial direction; strain to velocity in the tangential direction.
The Engineering Mechanics of Interplanetary Trajectories